Constraint vs Other Layouts- A Battle towards performance Part-2
Blog by theDroidLady

Introduction
In the last article, I showed off my love for fashion which lead me to correlate it with the topic at hand i.e, how UI is created and what will be the impact of view lifecycle methods in the context of various layouts.
In this blog, I will be discussing various tools I used to measure performance-
1) GPU overdraw
2) Systrace
But before going into performance metrics, one should know the 16 ms/frame logic.
Human eyes and 16 ms per refresh
The human brain receives and processes visual information continuously.This allows us some cool tricks.
For example, when still images are displayed to follow each other fast enough, we perceive them as motion.
A flip book is a good example that’s just at the edge of perception.
Flip books are just at the edge of what humans perceive as motion.
1) At about 10–12 pages per second, there is clearly motion, but you also retain awareness of individual pages.
2) 24 pages per second allow the human eye to see fluid motion, thanks to technologies such as motion blurring, which help you perceive motion when you should just see each individual frame of the animation. 24 images per second is a sweet spot for the film industry since it’s fast enough to show motion but cheap enough to produce films on a budget.
3) 30 pages per second is sufficient, but not life-like. It is enough for movies, but without fancy cinematic effects, it’s not convincing.
4) 60 pages per second is ideal, as most people see this as high-quality, smooth motion.
GPU Overdraw
Overdraw as the name suggests is a term used to describe how many times a pixel on the screen has been redrawn in a single frame.
Imagine painting a room and re-painting it all over again; this results in wasting time and energy to paint the room the first time. With overdraw in Android, we waste GPU time by coloring the pixels on the screen that end up being colored again by something else later.
Fortunately, we can detect re-painting in android by selecting “Show overdraw areas” in “Debug GPU overdraw” under “Developer options” in phone settings.
The colors are hinting at the amount of overdraw on your screen for each pixel, as follows:
1) True colour: No overdraw
2) Blue: Overdrawn once
3) Green: Overdrawn twice
4) Pink: Overdrawn thrice
5) Red: Overdrawn four or more times
We can prevent this re-painting by keeping the following things in mind -
1) If you are using unnecessary background(transparent/white/Common background), remove that immediately.
2) Flatten the hierarchy as much as possible.
Systrace
Systrace(Android System Trace) captures and displays the execution time of your app’s processes and other Android system processes, which helps you analyze the performance of your app.
The tool combines data from the Android kernel such as the CPU scheduler, disk activity, and app threads.
The tool uses this data to generate an HTML report that shows an overall picture of an Android-powered device’s system processes for a given period of time.
What you should do
1) Find the Frames section in the Systrace output and get more information about specific frames.
2) Examine the alerts, which show potential performance issues with your code.
Running Systrace through Command Line
I always prefer the command line(terminal) over UI frameworks as terminal always gives you more power than a UI framework possesses.
To generate the HTML report for the app, you need to run systrace from the command line using the following syntax:
python systrace.py [options] [categories]
Capturing a System Trace on Device
For Android 9 or higher, we already have the System Tracing app which works exactly the same way command-line utility works.
Developer Options -> Debugging -> System Tracing ->Record trace -> Do some Actions in your app -> Stop Trace -> Share Trace (.perfetto-trace)-> Open on Perfetto UI
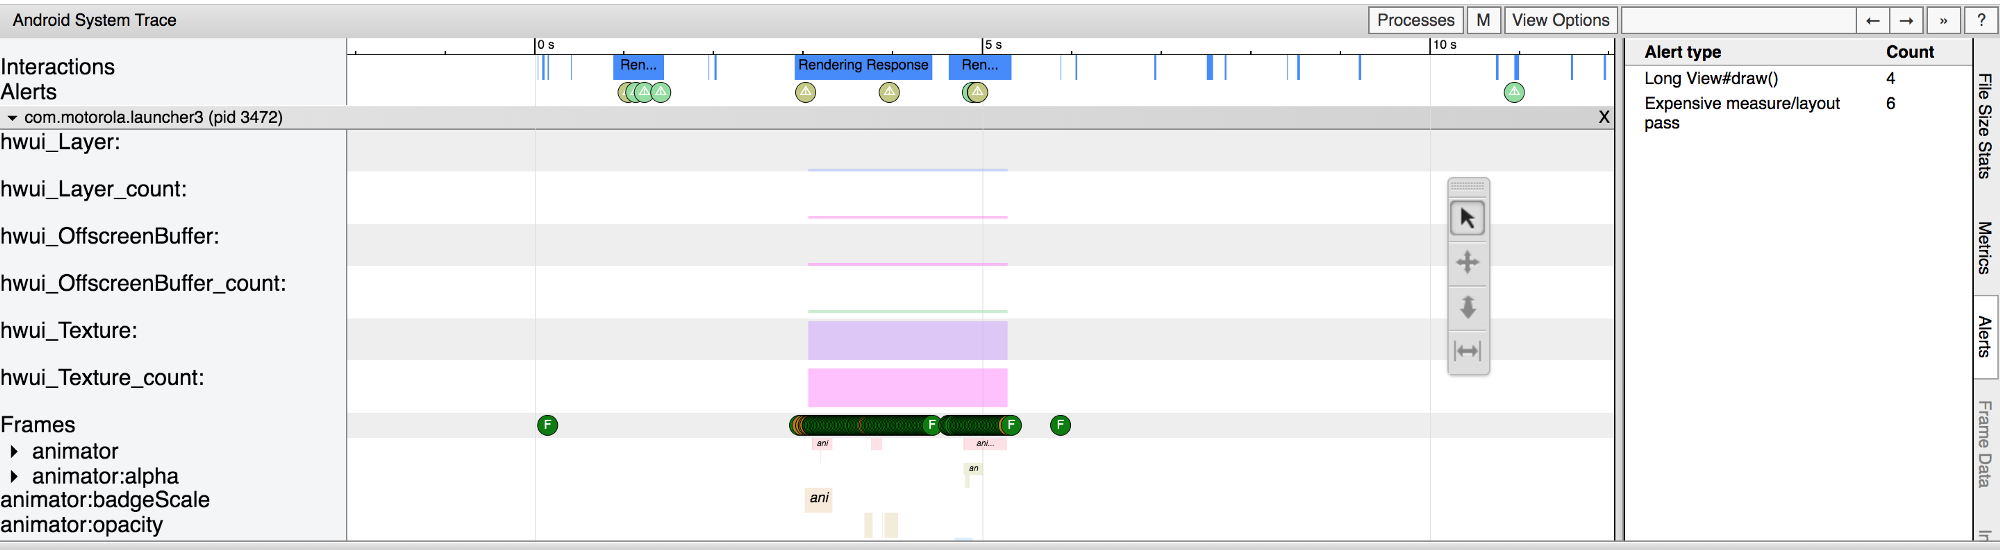
The image displays a part of the Systrace output. The numbers have the following meanings:
1) Section for each process
2) Frames section
3) Frame indicator for a frame that rendered successfully
4) Frame indicator for a frame that did not completely render
5) Method calls for rendering selected frame
Let me explain some of the key points -
1) In the Frames line, on the graph to the right, you should see circles that are either green or red and are labelled with the letter F for Frame. You may need to zoom in (w on the keyboard) and pan right (d on the keyboard) to see individual, labelled circles.
2) Select a green circle. This frame is green because it completed rendering in the allotted time slot of 16 milliseconds per frame.
3) Select a red circle. This frame is red because it did not complete rendering within 16 milliseconds.
4) On the left-hand pane, scroll down if necessary until you find Render Thread.
On devices running Android 5.0 (API level 21) or higher, this work is split between the UI Thread and RenderThread. On prior versions, all work for creating a frame is done on the UI thread. If you do not see Render Thread, select UI Thread instead.
5) Click on the black triangle to the right of Render ThreadM to expand the graph. This expands the bars that show you how much time was spent in each system action involved in rendering this frame.
6) Open the Alerts tab on the right edge of the trace window. Click on an Alert type to see a list of all alerts in the bottom pane. Click an alert to see details, a description of what may be the problem, and links to further resources.
To get into more detail on how systrace works, Please go through this link.
In the next blog, I have shared the results I got after testing similar screens with different layouts.