Memory Management in Android
Blog by theDroidLady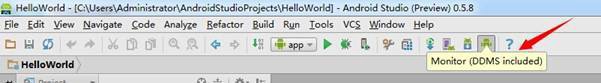
Introduction
Android uses paging and mmap instead of providing swap space, which means any memory your application touches cannot be paged out unless you release all references.
The Dalvik* Virtual Machine’s heap size for application processes is limited. Applications start up with 2 MB, and the maximum allocation, marked as “largeHeap,” is limited to 36 MB (depending on the specific device configuration).
Examples of large heap applications are Photo/Video Editor, Camera, Gallery, and Home Screen.
Android stores background application processes in a LRU cache.
When the system runs low on memory, it will kill processes according to the LRU strategy, but it will also consider which application is the largest memory consumer. Currently the maximum background process count is 20 (depending on the specific device configuration). If you need your app to live longer in the background, de-allocate unnecessary memory before moving to the background and the Android system will less likely generates error message or even terminates the app.
Garbage collection
A managed memory environment, like the ART or Dalvik virtual machine, keeps track of each memory allocation.
Once it determines that a piece of memory is no longer being used by the program, it frees it back to the heap, without any intervention from the programmer.
The mechanism for reclaiming unused memory within a managed memory environment is known as garbage collection. Garbage collection has two goals: find data objects in a program that cannot be accessed in the future; and reclaim the resources used by those objects.
Android’s memory heap is a generational one, meaning that there are different buckets of allocations that it tracks, based on the expected life and size of an object being allocated. For example, recently allocated objects belong in the Young generation.
When an object stays active long enough, it can be promoted to an older generation, followed by a permanent generation.
Each heap generation has its own dedicated upper limit on the amount of memory that objects there can occupy. Any time a generation starts to fill up, the system executes a garbage collection event in an attempt to free up memory.
The duration of the garbage collection depends on which generation of objects it’s collecting and how many active objects are in each generation.
Even though garbage collection can be quite fast, it can still affect your app’s performance. You don’t generally control when a garbage collection event occurs from within your code. The system has a running set of criteria for determining when to perform garbage collection.
When the criteria are satisfied, the system stops executing the process and begins garbage collection. If garbage collection occurs in the middle of an intensive processing loop like an animation or during music playback, it can increase processing time. This increase can potentially push code execution in your app past the recommended 16ms threshold for efficient and smooth frame rendering.
Additionally, your code flow may perform kinds of work that force garbage collection events to occur more often or make them last longer-than-normal.
For example, if you allocate multiple objects in the innermost part of a for-loop during each frame of an alpha blending animation, you might pollute your memory heap with a lot of objects.
In that circumstance, the garbage collector executes multiple garbage collection events and can degrade the performance of your app.
DDMS
Android studio includes a debugging tool called the Dalvik Debug Monitor Service (DDMS). DDMS provides services like screen capture on the device, threading, heap information on the device, logcat, processes, incoming calls, SMS checking, location, data spoofing, and many other things related to testing your Android application.
DDMS connects the IDE to the applications running on the device. On Android, every application runs in its own process, each of which hosts its own virtual machine (VM). And each process listens for a debugger on a different port.
When it starts, DDMS connects to ADB (Android Debug Bridge which is a command-line utility included with Google’s Android SDK.). An Android Debugger is used for debugging the Android app and starts a device monitoring service between the two. This will notify DDMS when a device is connected or disconnected. When a device is connected, a VM monitoring service is created between ADB and DDMS, which will notify DDMS when a VM on the device is started or terminated.
How to Improve Memory Usage
Android is a worldwide mobile platform and millions of Android developers are dedicated to building stable and scalable applications. Here is a list of tips and best practices for improving memory usage in Android applications:
1) Be careful about using a design pattern with “abstraction”. Although from the point of view of design pattern, abstraction can help to build more flexible software architect. In mobile world, abstraction may involve side effect for its extra code to be executed, which will cost more time and memory. Unless abstraction can provide your application a significant benefit, you would be better not to use it.
2) Avoid using “enum”. Enum will double memory allocation than ordinary static constant, so do not use it.
3) Try to use the optimized SparseArray, SparseBooleanArray, and LongSparseArray containers instead of HashMap. HashMap allocates an entry object during every mapping which is a memory inefficient action, also the low performance behavior — “autoboxing/unboxing” is spread all over the usage. Instead, SparseArray-like containers map keys into plain array. But please remember that these optimized containers are not suitable for large numbers of items, when executing add/remove/search actions, they are slower than Hashmap if your data set is over thousands of records.
4) Avoid creating unnecessary objects. Do not allocate memory especially for short-term temporary objects if you can avoid it, and garbage collection will occur less when fewer objects are created.
5) Check the available heap of your application. Invoke ActivityManager::getMemoryClass() to query how many heap(MB) is available for your application. OutofMemory Exception will occur if you try to allocate more memory than is available. If your application declares a “largeHeap” in AndroidManifest.xml, you can invoke ActivityManager::getLargeMemoryClass() to query an estimated large heap size.
6) Coordinate with the system by implementing onTrimMemory() callback. Implement ComponentCallbacks2::onTrimMemory(int) in your Activity/Service/ContentProvider to gradually release memory according to latest system constraints. The onTrimMemory(int) helps overall system response speed, but alsokeep your process alive longer in the system.
7) When TRIM_MEMORY_UI_HIDDEN occurs, it means all the UI in your application has been hidden and you need to free UI resources. When your application is foreground, you may receive TRIM_MEMORY_RUNNING[MODERATE/LOW/CRITICAL], or in the background you may receive TRIM_MEMORY_[BACKGROUND/MODERATE/COMPLETE]. You can free non-critical resources based on the strategy to release memory when system memory is tight.
8) External libraries should be used carefully. External libraries are often written for non-mobile device and can be inefficient in Android. You must take into account the effort in porting and optimizing the library for mobile before you decide to use it. If you are using a library for only one or two features from its thousands of other uses, it may be best to implement it by yourself.
9) Services should be used with caution. If you need a service to run a job in the background, avoid keeping it running unless it’s actively performing a task. Try to shorten its lifespan by using an IntentService, which will finish itself when it’s done handling the intent. Services should be used with the caution to never leave one running when it’s not needed. Worst case, the overall system performance will be poor and users will find your app and uninstall it (if possible).
10) But if you are building an app that needs to run for a long period of time, e.g., a music player service, you should split it into two processes: one for the UI and the other for the background service by setting the property “android:process” for your Service in AndroidManifest.xml. The resources in the UI process can be released after hidden, while the background playback service is still running. Keep in mind that the background service process MUST NOT touch any UI; otherwise, the memory allocation will be doubled or tripled!
How to Avoid Memory Leaks
Use memory carefully with above tips can bring benefit for your application incrementally, and make your application stay longer in system. But all benefit will lost if memory leakage happens. Here are some familiar potential leakage that developer needs to keep in mind.
1) Remember to close the cursor after querying the database. If you want to keep the cursor open long-term, you must use it carefully and close it as soon as the database task finished.
2) Remember to call unregisterReceiver() after calling registerReceiver().
3) Avoid Context leakage. If you declare a static member variable “Drawable” in your Activity, and then call view.setBackground(drawable) in onCreate(), after screen rotate, a new Activity instance will be created and the old Activity instance can never be de-allocated because drawable has set the view as callback and view has a reference to Activity (Context). A leaked Activity instance means a significant amount of memory, which will cause OOM easily.
4) There are two ways to avoid this kind of leakage:
-
Do not keep long-lived references to a context-activity. A reference to an activity should have the same life cycle as the activity itself.
-
Try using the context-application instead of a context-activity.
5) Be careful about using Threads. Threads in Java are garbage collection roots; that is, the Dalvik Virtual Machine (DVM) keeps hard references to all active threads in the runtime system, and as a result, threads that are left running will never be eligible for garbage collection. Java threads will persist until either they are explicitly closed or the entire process is killed by the Android system. Instead, the Android application framework provides many classes designed to make background threading easier for developers:
- Use Loader instead of a thread for performing short-lived asynchronous background queries in conjunction with the Activity lifecycle.
- Use Service and report the results back to the Activity using a BroadcastReceiver.
- Use AsyncTask for short-lived operations.
Android Profiling Tools
Android Profiling Tool will help you in managing your memory on the Android device. The Android SDK provides two ways of profiling app memory:
1) Using Allocation Tracker
2) Using Heap Dump
Using Allocation Tracker:
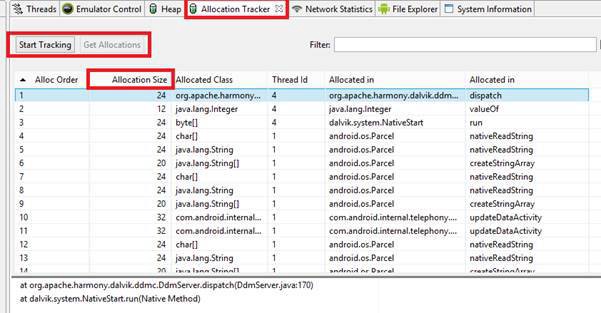
Allocation Tracker records each memory allocation that your application performs during the profiling cycle. The Allocation Tracker is useful when you want to find out which type of memory allocation is taking place. But it does not give you any information about the application’s heap which is the memory set aside for dynamic memory allocation.
The Allocation Tracker displays the memory allocation for the selected process. It shows the specific objects that are being allocated along with the thread, method and the line code that allocated them.
DDMS provides a feature to track objects that are being allocated to memory and to see which classes and threads are allocating the objects. This allows you to track where the objects are being allocated in real time, when you perform certain actions in your application. This data is valuable for measuring memory usage that can otherwise affect application performance.
Steps for starting Allocation Tracker in Android DDMS
1) Install your app in Android emulator or device. Click on Android button available at the bottom of the Android Studio.
2) Start allocation tracking.
3) Play around with app for some time.
4) Stop allocation tracking.
Refer to the Figure below:
5) After a few seconds, a pane with your recorded data opens.
Heap Dumps
A Heap Dump is a snapshot of an application’s heap, which is stored in a binary format called HPROF. The Dalvik virtual machine can produce a complete dump of the contents of the virtual heap. This is very useful for debugging memory usage and looking for memory leaks.
Note :
I would say developing an android application is easy but optimization and memory management requires time and work. Developer should focus on these parameters.